
THIS MORNINGS QUICK LOOK
- TOUR DE MTG FINANCE – My Free MBS Site & How To Understand It
START EACH MORNING WITH EASY TO READ MBS UPDATE
TEXT “I’M IN” TO 251-428-1564 – IT’S FREE
Tour De Mortgage Finance Learn Something New Everyday About Your Industry
FREE MBS SITE AND HOW TO UNDERSTAND IT
DUE TO THE LENGTH OF THIS POST IT IS THE ONLY ONE FOR TODAY : )
Thanks to Dawn for asking me how to understand the MBS chart on my free service that I provide. As you read if you dare to read so much just have the below pic to reference. Otherwise, swipe left and stay ignorant. HA!
FREE MBS SITE – https://www.jack.keeler.fsbmbs.com/
Password is flagstarjack
After reading this you should be able to understand what I send out everyday. Reminder to text “I’M IN” to 251-428-1564 to be added to my daily MBS text updates.
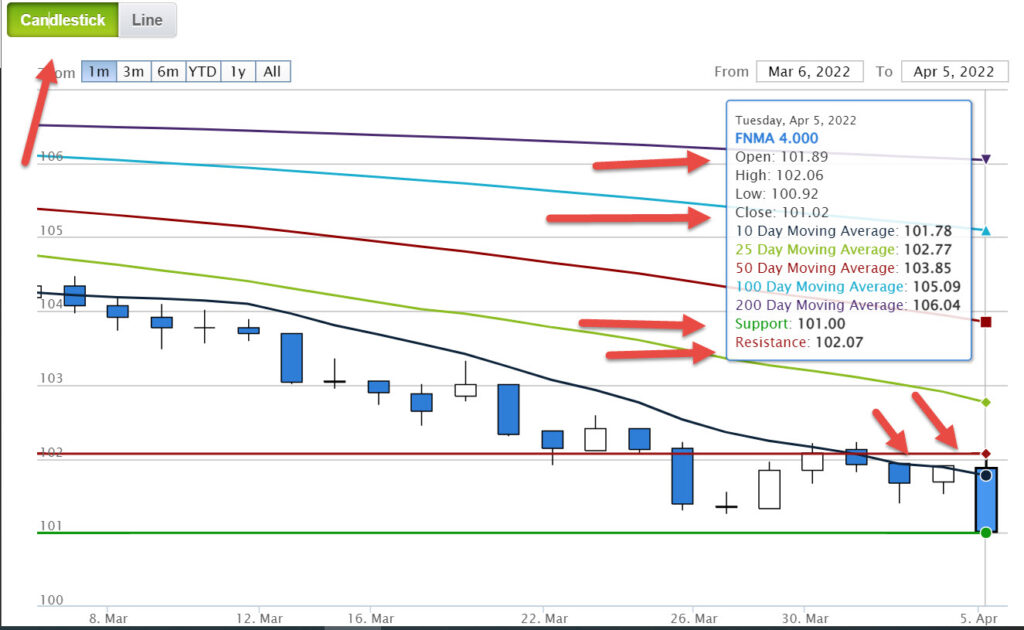
First, when you open site use the candlestick at the top left vs the line (see below pic). It is easier to read what is happening on any give day.
Second, if you hover over the candlestick on any given day it pops up that box on the right where it says FNMA 4.000 in blue. (See pic below) or login.
That is what has happened during that days trading. Yesterday morning we opened at 101.89 on the 4% coupon. 4% translated to rates is 4.75%ish paying 101.89. Just think when it says 4% the end rate to you is about .75% higher. DO NOT try to match them up. They will not. It just allows for servicing fees, gfees to the agencies, loan level price adjustments and everything else. It may be way off from what you see.
So we opened at 101.89 and we closed the day at 101.02. That means we lost 87 BPS. 101.89 – 101.02 = 87 to the negative. Every PBS (basis point) in yield equates to $10 per 100K in loan amount. So losing 87 BPS on the day = $870 per 100K in loan size estimated. That is an easy way to understand the impact of BPS on any given day as to gains or losses on your yields or your borrowers.
On the free service I provide the blue candlestick tells you that you lost BPS on that day. On the white candlesticks that means we gained BPS on that day. Gaining just means the investor pays us MORE BPS for the 4% coupon and if they pay us more we can pay you more or in reality paying you the same for a lesser rate. If we lose BPS that means the investor pays us LESS BPS for the 4% coupon and because they are paying us less in order to pay you the same we must raise the rate.
Towards the bottom you see the word support in green. The green line or support line is what I reference as the floor of support. That means when we are trading in a technical market that green line there is a good chance it will bounce off that floor and rebound up which means it is a good time to float as it may bounce UP.
The word resistance below in red is when I reference the ceiling of resistance. You see the red line is above the green line so if we are getting close to that red line then we may bounce off of that in technical trading and may go DOWN which means losing basis points which is bad.
Now the area between the green and red line is what we call the trading window that the BPS ping pongs back and forth in-between in normal trading.
Now when I say we are breaking through a floor of support or a ceiling of resistance that means technical trading is out the window and news or the FED or a war or inflation is impacting the bond sales which we have seen a lot lately and you may not be as confident with those floor or support lines.
As an example count 8 candlesticks back from the right. Now look between the Red and Green line and you will notice it hit the ceiling of resistance on a multitude of days but it kind of stayed in that trading window. Then the days before that it was in a trading window for multiple days.
So we were testing the ceiling and they bounced. It is a good time to lock usually when you are near the ceiling of resistance because it may bounce down and a good time to float when you are on the floor as it may bounce up.
This trading window is the exact same as a stock trading window. You sell when it gets up high and you buy when it is down low. You do not sell when you are down low or buy when it is way up. Same goes for the logic in locking.
Now above those you see all of the days of moving averages and those pretty lines. All of the moving averages is just an average of the amount that coupon was paying in BPS over that given period of time. So the 10 and 200 day moving average are just an average of that coupon for 10 or 200 days. Those pretty lines are also floors of support and ceilings of resistance when we get to them. We typically bounce off of those as well and are only there to show a technical trading assumption when deciding whether to lock or not.
Towards the bottom of the page you will see the other coupons listed. (You will need to login to site) 4%, 4.5%, 5%, 5.5% and how they are trading. Just add .75%ish to those rates and if that is where you are pricing then it will make a difference. We choose the 4% because it is the most heavily traded coupon on the market.
This is the reason why when you look at a rate sheet and you notice the 4.25% rate is paying say 102.00 but the 4.375% rate is paying 101.5%. Why would it be paying less for a higher rate? It is because it is a different coupon that is being traded and it may be trading worse than the lower rate. That is why it is vital to always look at the entire rate sheet when pricing a loan. Many times you may get a .5% better rate for a very small amount in pricing.
The service also gives you the prime rate and others and stock pricing. Usually stocks and bonds go opposite but no guarantees either way with current turmoil.
Well, there you have it. Does it make sense? If not, just email me a clarifying question and I will be more than happy to explain it to you and hopefully this will help you better understand what the heck I am talking about every day.